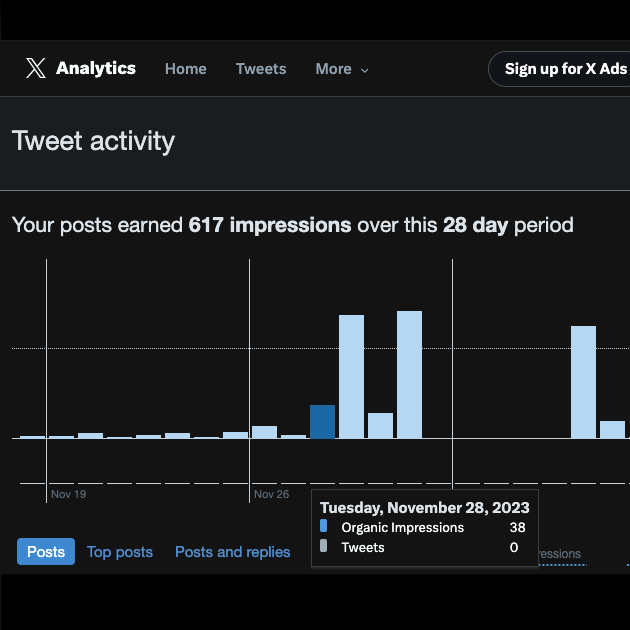
Do you know how to fully leverage your X-Twitter data to improve your performance? With millions of active users every day, this platform offers unique opportunities, but only precise tracking of key indicators allows you to optimize your results. By understanding your statistics and adjusting your strategy accordingly, you can transform your online presence into a real lever for success. Discover in this article how to effectively analyze your data and refine your actions to maximize your impact!
1. Understanding Key Performance Indicators on X-Twitter
Analyzing your data on X-Twitter begins with identifying the key performance indicators (KPIs) that measure the impact of your posts and guide your strategic decisions. This data provides you with an accurate view of the effectiveness of your presence on the platform.
The main KPIs to monitor
- Engagement Rate : This KPI encompasses likes, retweets, replies, and clicks on your tweets. A high rate reflects an active audience interested in your content. For example, an informative tweet accompanied by an attractive visual often generates more engagement than plain text.
- Post Reach : Reach indicates how many unique users have seen your content. Increasing reach indicates the relevance of your messages and your ability to reach new audiences.
- Impressions : Unlike reach, impressions measure the total number of times a tweet has been displayed, even multiple times by the same user. This KPI helps evaluate the overall visibility of your posts.
- Follower Growth : This indicator measures the evolution of your audience. A steady increase in followers indicates that your content is attracting and retaining new users.
Tools for analyzing this data
- X-Twitter Analytics : Accessible directly on the platform, this native tool provides detailed insights into your KPIs, such as engagement and impressions.
- Third-party tools like Sosoon : They offer in-depth and centralized analysis, ideal for managing multiple accounts and comparing performances.
Concrete Example
Imagine that a tweet containing an educational infographic achieves an engagement rate of 10% and generates 50 new followers in one day. This data proves the effectiveness of this format, allowing for prioritization in your future campaigns.
2. Adapting Your Strategy Based on Collected Data
Analyzing data on X-Twitter is not limited to information gathering; it must be followed by concrete actions to optimize your performance. A well-adjusted strategy, based on insights from your KPIs, allows you to maximize the impact of your posts while meeting your audience’s expectations.
Adjusting Your Posting Schedule
Data on engagement and reach reveal the moments when your audience is most active. For example, if your tweets posted in the morning generate 30% more interactions than those posted in the afternoon, focus your efforts during this time frame.
Optimizing the Type of Shared Content
By analyzing the highest performing tweets, identify the formats that work best:
- Visuals and Infographics : Often more attractive than text alone, they generate higher click rates.
- Polls and Questions : These interactive formats stimulate conversations and enhance engagement.
- Detailed Threads : Ideal for diving deeper into a subject and capturing your audience on complex topics.
For example, if your educational threads on market trends achieve an engagement rate 50% higher than your other tweets, it makes sense to produce more of them.
Segmenting and Personalizing Your Messages
Your engagement data may reveal subgroups of your audience with specific interests. Tailor your content to these segments to maximize relevance. A tech brand, for instance, might target developers with technical information and students with simplified tutorials.
Continuously Test and Adjust
Use A/B testing to compare different approaches. For example, test two different tones – one informal, the other professional – to measure which resonates best with your audience. This constant experimentation process ensures a gradual improvement in your results.
Concrete Example
A company noticed that its tweets containing polls received an engagement rate of 12%, compared to 7% for other formats. By adapting its strategy to include a weekly poll, it doubled its click rate in three months.
Adapting your strategy based on collected data allows you to remain agile and relevant in a constantly evolving digital environment.
Analyzing your X-Twitter data is essential to refine your strategies and maximize your performance. By combining a precise reading of KPIs with tools like Sosoon, you optimize your impact and convert your efforts into concrete results.